Debugging iOS webviews
Debugging web applications are made easy with chrome dev tools and inspect devices for android. But what if we want to debug our web app in ios browsers?
There may have some issues specific to ios device browsers may be due to their security policies.
For example, ipad/iphone restricts camera access in chrome browser if the underlying ios version is < 14.3.
Objective: Implement barcode scanning
Assume we have a dedicated ios app for scanning barcode in ios < 14.3 devices. Interaction between web app and ios app is achieved via a custom url.
customUrl = protocol + 'token:' + userToken + ',url:' + searchCallbackURL + ',browserId:' + browserId;
where,
protocol – IOS app scheme used to open ios app for barcode scanning
searchCallbackURL – callback url to return barcode search result to web app
The data from the callback url is used to link the scanned item to the web app. The best thing is that the goal is achieved without depending any paid apps, that’s awesome.
What if something goes wrong on feature customization?
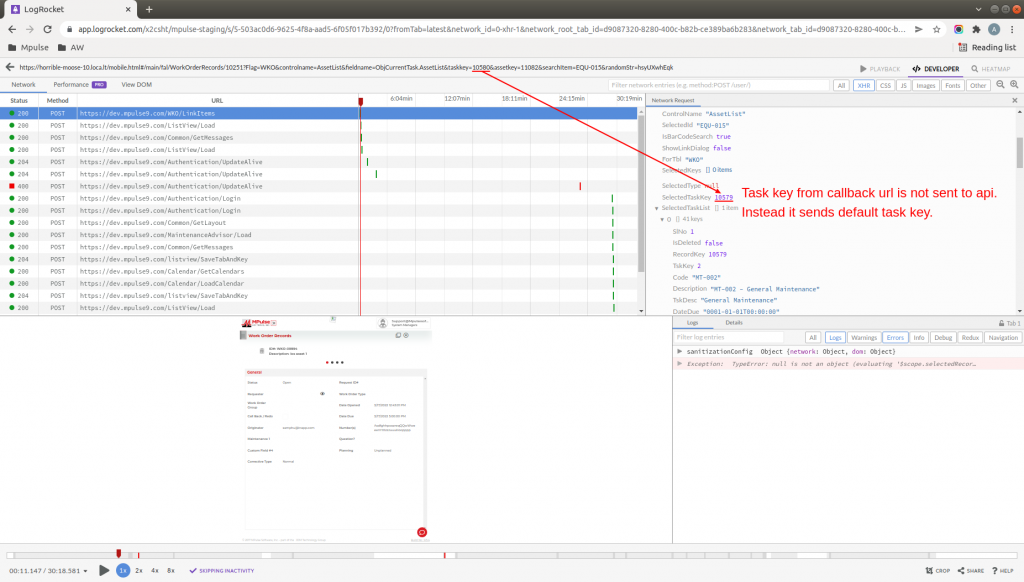
Issue: Scanned item from the callback url is linked to a different record.
Reason: On loading the callback url, it selects the default record and not the one specified in the callback url.
Solution: Select the record based on the data specified in the callback url.
It just works fine when simulating the callback url but not when redirecting from ios app!
Challenges: Debugging webviews in iOS chrome browser
#1. chrome://inspect
Enable JavaScript log collection by navigating to chrome://inspect in Chrome for iOS and leaving that tab open to collect logs. In another tab, reproduce the case for which we are interested. Then switch back to the chrome://inspect tab to view the collected logs.

Obviously, these logs aren’t enough for identifying the cause.
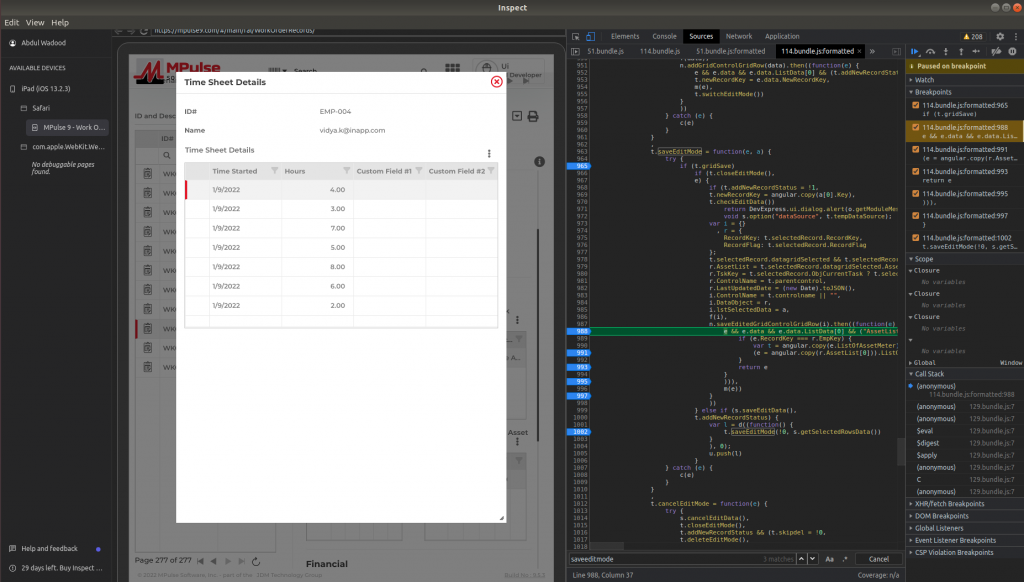
#2. Inspect.dev
Debugging iOS webviews requires Safari, so your dev computer must be running macOS.
Most of us do not have macOS but luckily inspect.dev can be used to debug from windows or linux. Unfortunately inpect.dev cannot debug chrome browser.

#3. LogRocket
LogRocket is a tool used for frontend monitoring and product analytics.
Their free version is enough for us to debugging.
A few of the available features includes:
– video recording of the session
– view DOM elements and CSS styling at any given session time
– event timeline including mouse/keyboard events, navigations etc
– network request/response and console logs
A few of the features not available includes:
– source code for setting breakpoints
– view localstorage data
There are some limitations and the support team may be adding those as feature requests.
Configuring LogRocket is simple:
– Signup and create a project in LogRocket
– Add cdn to our source code
<script src="https://cdn.lr-in.com/LogRocket.min.js"></script>
– LogRocket.init(YOUR_APP_ID);

On seeing the network request, I realized that I missed the fix in mobile responsive page. Earlier fix is done only for web app and thats the reason it works fine on simulating the callback url but not from ios device.
There is one another interesting bug which is identified with the help of LogRocket.
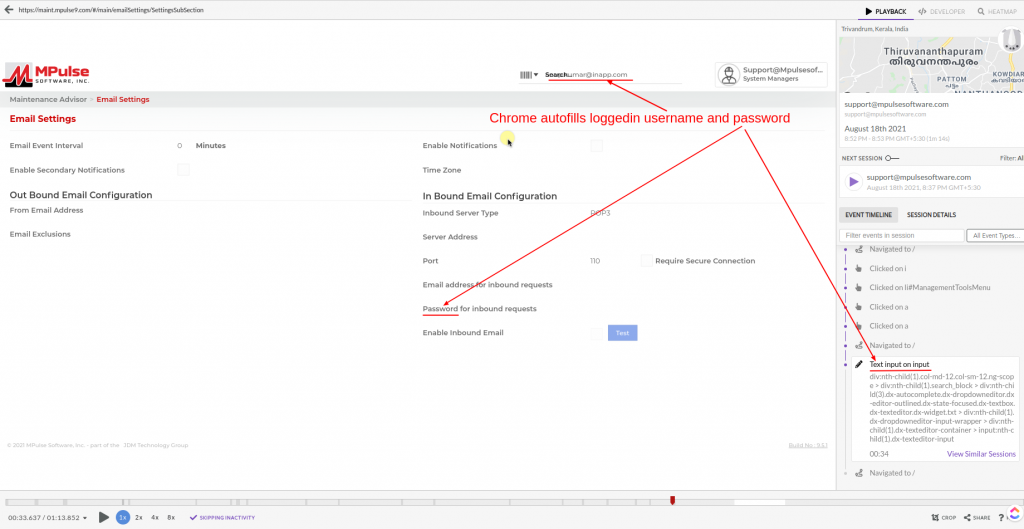
On loading a particular module, the user is automatically redirected to the global search page. This issue happens only for particular clients.

With the help of LogRocket, we understand that the browser’s password manager is autofilling search text box and empty password field with saved username and password respectively.
Browser assumes any field before a password field is username.
Without LogRocket the reason to this redirection may not be identified.
Conclusion
LogRocket can be used for debugging webviews in mobile devices. Moreover, custom charts or filters can be used for identifying product usage trend and there by improving our product sales.
There are a few more debugging tools like jsconsole and weinre.

